Google Analytics 4 (GA4) runs on over 14 million active websites and holds 71% of the web analytics market. For content teams, it is the primary tool for tracking performance, measuring ROI, and understanding how content performs across Google, Perplexity, ChatGPT, and Claude.
But most content teams use GA4 poorly. They rely on default reports, never set up custom dimensions, and miss entire traffic segments from AI search engines. The result is incomplete data that leads to bad content decisions.
This guide covers exactly how content teams should set up and use GA4, with specific configurations, real benchmarks, and the 2026 features that matter most for content performance tracking.
Why GA4 Matters for Content Teams in 2026
1. AI Search Traffic Is Growing Fast (and Hard to Track)
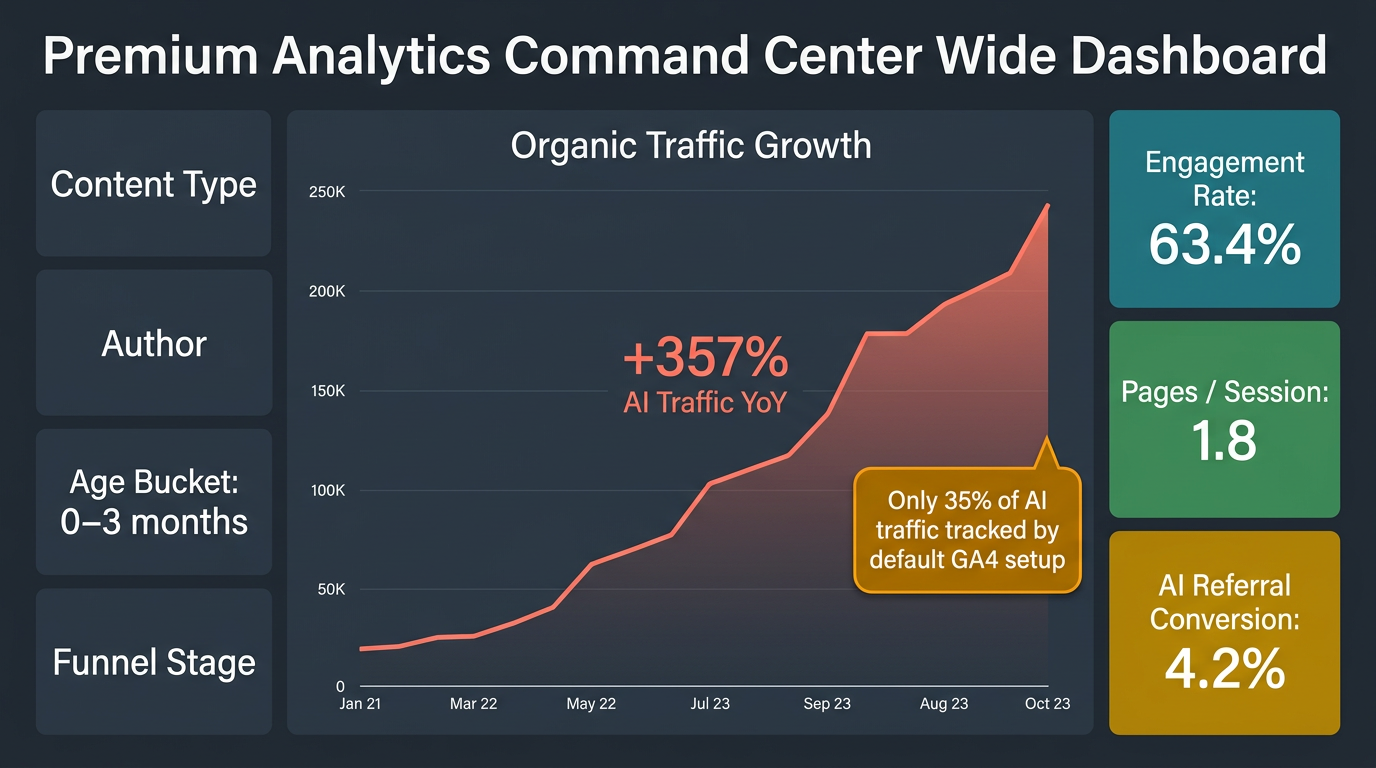
AI referral traffic now accounts for roughly 1% of all website traffic, but it grew 357% year-over-year through mid-2025. AI Overviews appear in 25% of Google searches as of Q1 2026. ChatGPT drives 87% of all AI referral traffic, with Perplexity at 4% and Claude at 2%.
The problem: GA4 does not have a built-in "AI" channel. Without custom configuration, AI traffic gets lumped into generic "Referral" or even "Direct" (mobile app clicks from ChatGPT and Claude strip referrer data entirely). Content teams that skip this setup are flying blind on one of the fastest-growing traffic sources.
For a deeper look at tracking across AI platforms, see our AI Search Engine Comparison 2026 and AI Citation Tracking guide.
2. Measure What Actually Converts
GA4's engagement model replaced Universal Analytics' bounce rate with a more useful metric. A session counts as "engaged" when a user stays 10+ seconds, views 2+ pages, or triggers a conversion event. The median engagement rate across all industries is 56-62%, with B2B sites averaging 63% and B2C hitting 71%.
These benchmarks give content teams a real baseline. If your blog posts sit below 55% engagement rate, that signals a content quality or UX problem. Above 70% is excellent.
3. Prove Content ROI with Revenue Data
Content teams that cannot show revenue impact get their budgets cut. GA4 connects content consumption to conversions and revenue, giving you the data to justify headcount and tooling. This ties directly into ROI Measurement for AI-Optimized Content, where we break down the full ROI calculation framework.
4. Optimize Across the Full Funnel
GA4's exploration reports let you trace a reader from first blog visit through trial signup to paid conversion. You can segment by content type, author, funnel stage, and traffic source to identify which content strategies actually move the needle. Teams that use this data to allocate budgets between AI content and traditional SEO consistently outperform those that rely on gut decisions.
GA4 Setup for Content Teams
Account and Property Configuration
Create your property:
- Create a GA4 account and property at analytics.google.com
- Install the GA4 tracking code (gtag.js or Google Tag Manager)
- Verify data collection in the real-time report
Property settings to configure immediately:
- Set correct timezone and currency (affects how sessions are counted and revenue is reported)
- Enable Enhanced Measurement (tracks scrolls, outbound clicks, site search, video engagement, and file downloads automatically)
- Set up a single web data stream for your site
Filter internal traffic: One of the most common mistakes is letting team activity inflate metrics. Go to Admin, then Data Streams, then Configure Tag Settings, then Define Internal Traffic. Add your office IP ranges and any VPN IPs your team uses. Then activate the filter under Admin, then Data Settings, then Data Filters.
Custom Dimensions for Content Analysis
Default GA4 dimensions (page path, source, medium) are not enough for content teams. You need custom dimensions that let you slice performance by content type, author, age, and funnel stage.
Content Type Dimension:
This is the single most important custom dimension for content teams. It lets you compare how guides perform versus comparisons, product pages, FAQs, case studies, and other formats.
Setup: Go to Admin, then Custom Definitions, then Create Custom Dimension.
- Name: Content Type
- Scope: Event
- Event parameter:
content_type
Implementation (add to your dataLayer or gtag call on every page):
gtag('event', 'page_view', {
  'content_type': 'guide',        // guide, comparison, case-study, faq, product, landing
  'content_topic': 'ga4-analytics' // topic cluster identifier
});
Content Author Dimension:
Track which authors produce the highest-performing content. This is especially valuable for teams managing multiple writers or freelancers.
Setup: Same process as above.
- Name: Content Author
- Scope: Event
- Event parameter:
content_author
gtag('event', 'page_view', {
  'content_author': 'sarah-chen',
  'content_type': 'comparison'
});
Content Age Dimension:
Identifies when content starts to decay. Calculate the number of months since publication and send it as a parameter.
- Name: Content Age Bucket
- Scope: Event
- Event parameter:
content_age
// Calculate months since publication
const publishDate = new Date('2026-01-15');
const now = new Date();
const monthsOld = Math.floor((now - publishDate) / (1000 * 60 * 60 * 24 * 30));

let ageBucket;
if (monthsOld <= 3) ageBucket = '0-3 months';
else if (monthsOld <= 6) ageBucket = '3-6 months';
else if (monthsOld <= 12) ageBucket = '6-12 months';
else ageBucket = '12+ months';

gtag('event', 'page_view', {
  'content_age': ageBucket
});
This dimension is critical for content decay detection. When you can see that 6-12 month old content drops from 65% to 40% engagement rate, you know exactly when to schedule refreshes.
Funnel Stage Dimension:
Tag every piece of content with its position in the buyer journey: awareness, consideration, or decision. This lets you measure how well your content moves people through the funnel.
- Name: Funnel Stage
- Scope: Event
- Event parameter:
funnel_stage
gtag('event', 'page_view', {
  'funnel_stage': 'consideration',  // awareness, consideration, decision
  'content_type': 'comparison'
});
Custom Events for Content Engagement
Scroll Depth Tracking:
Enhanced Measurement tracks 90% scroll depth by default, but content teams need more granular data. Fire custom events at 25%, 50%, 75%, and 100%:
// Example using Intersection Observer or scroll listener
function trackScrollDepth(depth) {
  gtag('event', 'content_scroll', {
    'scroll_depth': depth,           // '25%', '50%', '75%', '100%'
    'content_id': 'post-ga4-guide',
    'content_type': 'guide',
    'content_author': 'sarah-chen'
  });
}
Content Download Events:
Track whitepaper, ebook, template, and checklist downloads:
gtag('event', 'content_download', {
  'content_id': 'ebook-content-ops',
  'content_type': 'ebook',
  'content_topic': 'content-operations',
  'funnel_stage': 'consideration'
});
CTA Click Tracking:
Track which in-content CTAs drive clicks, so you know which placements and copy work:
gtag('event', 'cta_click', {
  'cta_text': 'Start Free Trial',
  'cta_position': 'mid-article',     // hero, mid-article, sidebar, end-article
  'content_id': 'post-ga4-guide',
  'content_type': 'guide'
});
Goals and Conversions
Set up conversion events for every action that matters to your business. In GA4, you mark events as "Key Events" (formerly called conversions as of March 2024).
Free Trial Signup:
gtag('event', 'free_trial_signup', {
  'content_id': 'post-ga4-guide',
  'content_type': 'guide',
  'funnel_stage': 'decision',
  'traffic_source': 'organic'       // helps with content attribution
});
Demo Request:
gtag('event', 'demo_request', {
  'content_id': 'post-comparison-seo-tools',
  'content_type': 'comparison',
  'funnel_stage': 'decision'
});
Revenue Tracking:
gtag('event', 'purchase', {
  'transaction_id': 'T12345',
  'value': 49.00,
  'currency': 'USD',
  'content_id': 'post-ga4-guide',   // last content piece before conversion
  'content_type': 'guide'
});
Mark each of these as Key Events in Admin, then Events, then toggle the "Mark as key event" switch.
Tracking AI Search Engine Traffic
This is the most important GA4 configuration for content teams in 2026. Without it, you cannot measure how your content performs across AI platforms.
Create a Custom Channel Group
GA4's default channel definitions lump AI search traffic into "Referral" or miss it entirely. Here is how to fix that:
- Go to Admin, then Data Display, then Channel Groups
- Click "Create new channel group"
- Add a new channel called "AI Search"
- Set the condition: Source matches regex:
chatgpt\.com|perplexity\.ai|claude\.ai|gemini\.google\.com|copilot\.microsoft\.com|meta\.ai|you\.com|chat\.mistral\.ai|felo\.ai
- Position this channel ABOVE "Referral" in the list (GA4 evaluates top to bottom, so if "Referral" comes first, AI traffic gets classified there instead)
What AI Traffic Actually Looks Like
Based on current data, here is what to expect:
| Source | % of AI Referral Traffic | Typical Conversion Rate |
|---|---|---|
| ChatGPT | 87% | 5-16% |
| Perplexity | 4% | 8-11% |
| Google Gemini | 3% (fastest growing, up 388% YoY) | Varies |
| Claude | 2% | Varies |
| Copilot | 2% | Varies |
| Others | 2% | Varies |
ChatGPT only began appending utm_source=chatgpt.com to desktop citation links in June 2025. Mobile app clicks from ChatGPT and Claude still strip referrer data and show up as Direct traffic. Google AI Overview clicks appear as standard Organic Search with no distinct referrer.
This means your actual AI traffic is higher than what GA4 reports. Account for this gap when presenting numbers to stakeholders.
For strategies on optimizing content for these platforms, see our multi-platform GEO strategy guide and Perplexity optimization guide.
UTM Parameters for Content Distribution
Use UTM parameters on all links you control (email, social, paid) to attribute traffic correctly:
| Channel | UTM Example |
|---|---|
| Newsletter | ?utm_source=newsletter&utm_medium=email&utm_content=guide&utm_campaign=weekly-april-2026 |
| Social (LinkedIn) | ?utm_source=linkedin&utm_medium=social&utm_content=comparison&utm_campaign=seo-tools |
| Paid promotion | ?utm_source=google&utm_medium=cpc&utm_content=ga4-guide&utm_campaign=content-promo |
Do not add UTM parameters to internal links (links within your own site). This breaks session tracking and creates false "new sessions."
GA4 Reports for Content Teams
Content Performance Report
Build this in Explorations (Explore tab, then Free Form):
Dimensions: Page path, Content Type (custom), Content Author (custom), Funnel Stage (custom)
Metrics: Sessions, Engaged Sessions, Engagement Rate, Average Engagement Time, Key Events, Revenue
How to read it: Sort by engagement rate to find your best-performing content. The median across industries is 56-62%. Interactive content (calculators, quizzes, tools) typically hits 65% versus 52% for static pages. If a content type consistently underperforms, investigate whether the format needs reworking rather than the topic.
AI Platform Performance Report
Source/Medium Report with Custom Channel Group:
- Go to Reports, then Acquisition, then Traffic Acquisition
- Switch to your custom channel group (the one with the "AI Search" channel)
- Drill into the AI Search channel to see individual platforms
What to look for:
- Which AI platforms send the most traffic (ChatGPT dominates, but Gemini is growing fastest)
- Engagement rate by platform (AI referral traffic often has higher engagement than generic organic)
- Conversion rates by platform (Perplexity traffic converts at 8-11%, often higher than organic)
- Which content types perform best on each platform
Author Performance Report
Create a custom exploration with the Content Author dimension:
Dimensions: Content Author, Content Type
Metrics: Sessions, Engagement Rate, Key Events, Revenue
This report reveals which authors produce the highest-ROI content. Use it for resource allocation decisions, not performance reviews. A single high-converting comparison post can outperform ten awareness articles in revenue. Context matters.
For guidance on building content teams around these insights, see Content Team Structure for 2026.
Content Age Performance Report
Dimensions: Content Age Bucket (custom), Content Type
Metrics: Sessions, Engagement Rate, Key Events
What it reveals:
- How quickly content decays by type (guides may last 12+ months; tool comparisons decay in 3-6 months)
- The optimal refresh window for each content type
- Which "evergreen" content actually stays evergreen
Teams that track content age alongside performance data can build systematic content refresh strategies and content pruning workflows instead of guessing which posts need attention.
Conversion Funnel Report
Funnel Exploration:
- Go to Explore, then Funnel Exploration
- Define funnel steps:
- Step 1: Page view (filter by content type or specific pages)
- Step 2: Content engagement (scroll 50%+ or 30+ seconds)
- Step 3: CTA click
- Step 4: Key Event (trial signup, demo request, purchase)
- Break down by Content Type or Funnel Stage
Benchmark: Average engagement time across all websites is 54 seconds per session. For long-form content (2,000+ words), aim for 3+ minutes. If users leave before the 50% scroll mark, the intro section needs work.
Attribution Modeling in GA4
What Changed (and What Most Teams Get Wrong)
In July 2023, Google removed four attribution models from GA4:
- First-click (removed)
- Linear (removed)
- Time-decay (removed)
- Position-based (removed)
Only two models remain:
- Data-Driven Attribution (DDA): GA4's default. Uses machine learning to distribute conversion credit based on your actual data.
- Paid and Organic Last Click: The last touchpoint before conversion gets 100% credit.
The critical detail most content teams miss: DDA requires at least 400 conversions over 28 days to activate. If your property falls below that threshold, GA4 silently falls back to last-click attribution without telling you. Most small and mid-size content sites do not meet this requirement.
To check: Go to Admin, then Attribution Settings. If DDA is selected but you have fewer than 400 monthly conversions, you are effectively running on last-click.
How Attribution Affects Content Measurement
User-scoped and session-scoped reports (Traffic Acquisition, User Acquisition) always use last-click attribution regardless of your property-level setting. Only event-scoped reports and explorations respect DDA.
This means your Traffic Acquisition report gives full credit to the last touchpoint. If a reader discovers your brand through a topical authority guide, then comes back through a comparison post and converts, the awareness guide gets zero credit in most standard reports.
Workaround: Use the Conversion Paths report (Advertising, then Attribution, then Conversion Paths) to see the full journey. This is the only standard report that shows multi-touch paths.
Per-Conversion Attribution (January 2026 Update)
As of January 2026, GA4 lets you set attribution models independently per conversion event. This means you can use DDA for purchase events (where you likely have enough data) and last-click for newsletter signups (where you may not).
Go to Admin, then Attribution Settings to configure this per Key Event.
GA4 + Google Search Console Integration
Setup
- Go to Admin, then Product Links, then Search Console Links
- Link your verified Search Console property
- Data appears within 48 hours
What the Combined Data Shows
The integration creates a Search Console report under Reports, then Search Console:
Queries report: Shows which search queries drive traffic, with impressions, clicks, CTR, and average position from Search Console, plus engagement rate and conversions from GA4.
Landing Pages report: Shows which pages rank for which queries, combined with on-site behavior.
Why this matters: A page might rank #3 for a high-volume keyword but have a 35% engagement rate, signaling that it ranks well but does not satisfy intent. Conversely, a page at position #8 with an 80% engagement rate and strong conversions is a prime candidate for SEO investment to push it higher.
This directly supports the SERP analysis and content brief workflows, where ranking data informs what content to create or refresh next.
Consent Mode v2 and Data Accuracy
This section is critical for teams with European or privacy-conscious audiences. Skip it at the cost of incomplete data.
What Consent Mode v2 Changes
Consent Mode v2 added two new parameters in 2024: ad_user_data (controls user data sent to Google for advertising) and ad_personalization (governs remarketing). As of July 2025, Google blocks conversion tracking and remarketing for EU/EEA users on non-compliant sites.
The impact on content analytics: Without proper Consent Mode implementation, GA4 suppresses data from users who do not consent to cookies. In the EU, where consent rates typically range from 40-70%, you could be missing 30-60% of your European audience data.
Advanced Consent Mode (Data Recovery)
Advanced Consent Mode sends anonymous, cookieless pings to Google even when users reject cookies. GA4 uses these pings for behavioral modeling, recovering up to 70% of otherwise lost attribution data.
Implementation checklist:
- Use a certified Consent Management Platform (CMP) that supports Consent Mode v2
- All six parameters must default to "denied" before user action
- Parameters update to "granted" only after explicit consent
- Implement Advanced mode (not Basic) to enable behavioral modeling
Common mistake: 67% of implementations contain violations, most often by defaulting to "granted" before the user takes action. Audit your implementation with Google Tag Assistant.
Advanced GA4 Features
BigQuery Export
Why content teams need it: GA4's interface limits you to 14 months of data retention (standard properties). BigQuery stores everything permanently and supports SQL queries that GA4's interface cannot handle.
Cost structure:
- Daily export: Free for properties under 1 million events per day
- Storage: $0.023/GB/month (active), $0.016/GB/month (90+ days untouched). First 10 GB free.
- Queries: $5 per TB scanned. First 1 TB/month free.
- Streaming export (near real-time): $0.05/GB
Critical limit: The free daily export caps at 1 million events per day. If your site exceeds this, exports pause entirely and do not backfill, creating permanent data gaps. High-traffic content sites need to monitor this or budget for GA4 360 ($50,000-$150,000/year).
Cost optimization:
- Always specify columns in queries (never use
SELECT *) - Filter on
_TABLE_SUFFIXfor date-based partition pruning - Use daily export instead of streaming unless you need near-real-time data
- Set budget alerts in Google Cloud Platform
Looker Studio Integration
Build dashboards that update automatically from GA4 data. Structure your dashboard in three layers:
Page 1, Executive Summary: KPIs at a glance. Total organic sessions, engagement rate, conversions, revenue. One scorecards row, one trend chart, one comparison table. This is what leadership sees.
Page 2, Content Performance: Detailed content analysis. Table with page path, content type, sessions, engagement rate, scroll depth, conversions. Filterable by date range, content type, and author.
Page 3, AI Traffic and Platform Analysis: AI Search channel performance, platform breakdown, conversion rates by source.
Common pitfall: 73% of Looker Studio templates crash in production due to GA4 API quota limits. Use the Extract Data connector (free, caches up to 100MB) instead of the native GA4 connector for dashboards that multiple people view. For high-traffic sites, route through BigQuery to eliminate quota issues entirely.
Analytics Advisor (Gemini-Powered)
Launched in December 2025 and now available on all GA4 properties. Ask questions in natural language like "Which content type has the highest conversion rate this quarter?" and get charts, tables, and explanations back.
Useful for content managers who need quick answers without building explorations. Not a replacement for proper report configuration, but a fast way to investigate hypotheses.
Predictive Audiences
GA4 can predict which users are likely to purchase, churn, or generate revenue over the next 7-28 days. Content teams can use this to:
- Create audiences of "likely subscribers" and export them to Google Ads for remarketing
- Identify likely-churning readers and target them with re-engagement content
- Prioritize follow-up on high-intent users who engaged with decision-stage content
Data requirement: Minimum 1,000 positive samples AND 1,000 negative samples in the past 28 days. Most small content sites will not meet this threshold. Focus on building these audiences once your traffic supports it.
GA4 Content KPIs and Benchmarks
Traffic KPIs
| Metric | Benchmark | Notes |
|---|---|---|
| Organic sessions growth | 15-25% quarter-over-quarter | Varies by content maturity |
| AI search traffic share | 1-3% of total (growing) | Set up custom channel to measure |
| Platform distribution | 60-70% Google, 5-15% AI engines combined | Expect AI share to grow through 2026 |
Engagement KPIs
| Metric | Benchmark | Target |
|---|---|---|
| Engagement rate | 56-62% median | Above 70% is excellent |
| Average engagement time | 54 seconds (all sites) | 2-4 minutes for long-form content |
| Scroll depth (50%+) | 45-55% of sessions | Above 60% for well-structured content |
| Pages per session | 1.8-2.2 average | Above 2.5 for content hubs |
Conversion KPIs
| Metric | Benchmark | Notes |
|---|---|---|
| Overall conversion rate | 2-5% | Varies by industry and content type |
| Decision-stage content conversion | 10-25% | Comparisons, pricing pages, case studies |
| Email signup rate | 1-3% of visitors | Higher with exit-intent and inline CTAs |
| Webinar registration rate | Up to 70% of landing page visitors | Highest-converting content format |
Revenue KPIs
| Metric | Benchmark | Notes |
|---|---|---|
| Revenue per content piece | $500-2,000 over 6-12 months | Depends on funnel stage and traffic |
| Content ROI | (Revenue - Production Cost) / Production Cost | Track per piece and per content type |
| Organic revenue growth | 20-30% quarter-over-quarter | Leading indicator of content program health |
For a complete framework on measuring content ROI beyond GA4, see ROI Measurement for AI-Optimized Content.
GA4 Mistakes to Avoid
1. Not Setting Up Custom Dimensions
Without custom dimensions, you cannot analyze by content type, author, or funnel stage. Default GA4 gives you page paths and traffic sources. That is not enough to make content strategy decisions. Set up the four custom dimensions described above before doing anything else.
2. Assuming Data-Driven Attribution Is Active
If your property has fewer than 400 conversions per month, GA4 silently falls back to last-click attribution even when DDA is selected. Check your conversion volume before trusting attribution reports. Most content-focused sites need to supplement GA4 attribution with their own analysis using BigQuery data.
3. Ignoring AI Traffic Classification
Without a custom "AI Search" channel group, traffic from ChatGPT, Perplexity, Claude, and Gemini gets classified as generic referral traffic or, worse, as direct traffic from mobile apps. Set up the custom channel group described in the AI traffic section. This takes five minutes and immediately gives you visibility into one of the fastest-growing traffic sources.
4. Not Filtering Internal Traffic
Your team visits your own content constantly. Even a small team of 5-10 people can inflate pageviews by 10-15% on lower-traffic pages. Configure internal traffic filters using IP ranges, and verify the filter is working by checking real-time reports from a filtered IP.
5. Skipping Consent Mode Implementation
If you have any European audience, skipping Consent Mode v2 means GA4 suppresses a large portion of your EU data. Advanced Consent Mode recovers up to 70% of lost data through behavioral modeling. The implementation is straightforward with a certified CMP.
6. Using GA4 Interface for Everything
GA4's interface works for quick checks, but it has limitations: 14-month data retention, sampling on high-traffic properties, and API quota limits that crash Looker Studio dashboards. For serious content analytics, export to BigQuery and build dashboards there. The free tier (1M events/day export, 1TB queries/month) is sufficient for most content sites.
7. Tracking Vanity Metrics
Pageviews without engagement context are meaningless. A post with 50,000 pageviews and a 30% engagement rate is underperforming compared to a post with 5,000 pageviews, 75% engagement, and a 12% conversion rate. Always pair traffic metrics with engagement and conversion metrics.
Putting It All Together: A Content Analytics Workflow
Weekly review (15 minutes):
- Check the Content Performance exploration for engagement rate trends
- Review AI Search channel performance in Traffic Acquisition
- Look at the top converting content pieces for the week
Monthly analysis (1 hour):
- Run the Author Performance report to assess content production ROI
- Check Content Age report for decay signals (any piece dropping below 50% engagement rate)
- Review Conversion Paths for multi-touch attribution insights
- Compare content type performance (are comparisons still converting better than guides?)
Quarterly strategy (half day):
- Export to BigQuery for historical trend analysis
- Calculate ROI per content piece and per content type
- Identify refresh candidates using content decay detection data
- Update content briefs based on what GA4 reveals about high-performing content patterns
- Present ROI data to stakeholders using Looker Studio dashboards
This workflow ensures GA4 data feeds directly into content strategy decisions rather than sitting in reports nobody reads.
Conclusion
GA4 gives content teams the data to make better decisions, but only when configured correctly. Set up custom dimensions for content type, author, age, and funnel stage. Create a custom AI Search channel group. Implement Consent Mode v2. Track conversions and revenue, not just pageviews.
The teams that connect content performance data to business outcomes, using proper attribution, funnel analysis, and ROI tracking, are the ones that keep their budgets and grow their programs.
Ready to create content worth tracking? RankDraft's research tools generate data-backed first drafts optimized for Google, Perplexity, ChatGPT, and Claude, so every piece starts with a foundation that GA4 data can build on.
Start Your Free Research Trial
Frequently Asked Questions
Q: How long does GA4 take to show data? A: Real-time data appears in minutes. Standard reports update in 4-12 hours. Custom dimensions may take 24-48 hours to populate on first setup. BigQuery daily exports arrive the following day, typically by mid-morning.
Q: How do I track AI search engine traffic in GA4? A: Create a custom channel group with an "AI Search" channel. Set the source condition to match the regex pattern covering chatgpt.com, perplexity.ai, claude.ai, gemini.google.com, copilot.microsoft.com, and other AI platforms. Position this channel above "Referral" in the evaluation order. Mobile app referrals from ChatGPT and Claude will still appear as Direct traffic since they strip referrer headers.
Q: Is data-driven attribution actually working on my property? A: Only if you have at least 400 conversions over a 28-day period. Below that threshold, GA4 silently falls back to last-click. Check your conversion volume in the Key Events report over the last 28 days. If you are below the threshold, acknowledge that your attribution data is last-click and plan accordingly.
Q: What is the difference between GA4 and Google Search Console? A: GA4 tracks what happens after a click: engagement, conversions, revenue. Search Console tracks what happens before a click: rankings, impressions, CTR. Use both. Link them in GA4 to see the full picture from search query to conversion.
Q: How do I handle GA4 data for EU audiences? A: Implement Consent Mode v2 with a certified CMP. Use Advanced mode (not Basic) to enable behavioral modeling, which recovers up to 70% of lost attribution data. All six consent parameters must default to "denied" until the user explicitly grants consent. Audit regularly, since 67% of implementations contain violations.
Q: Should I use GA4's built-in reports or build custom dashboards? A: Use built-in reports for quick daily checks. Build Looker Studio dashboards for team-level reporting (use the Extract Data connector to avoid API quota crashes). Use BigQuery for historical analysis and advanced queries. Match the tool to the question you are answering.
Q: How do I export GA4 data for custom reporting? A: Three options. CSV export works for one-off analysis. Looker Studio connects directly for automated dashboards. BigQuery export gives you raw event data for SQL analysis, machine learning, and long-term storage beyond GA4's 14-month retention limit. The free BigQuery tier (1M events/day, 1TB queries/month) covers most content sites.
Q: What GA4 skills should content team members have? A: Content writers need to read standard reports and understand engagement metrics. Content strategists should build custom explorations, configure dimensions, and interpret attribution data. Analytics leads should manage BigQuery exports, build Looker Studio dashboards, and run advanced funnel analysis. Start with the SEO tool stack guide to see how GA4 fits into the broader analytics toolkit.